Classification#
import numpy as np
import matplotlib.pyplot as plt
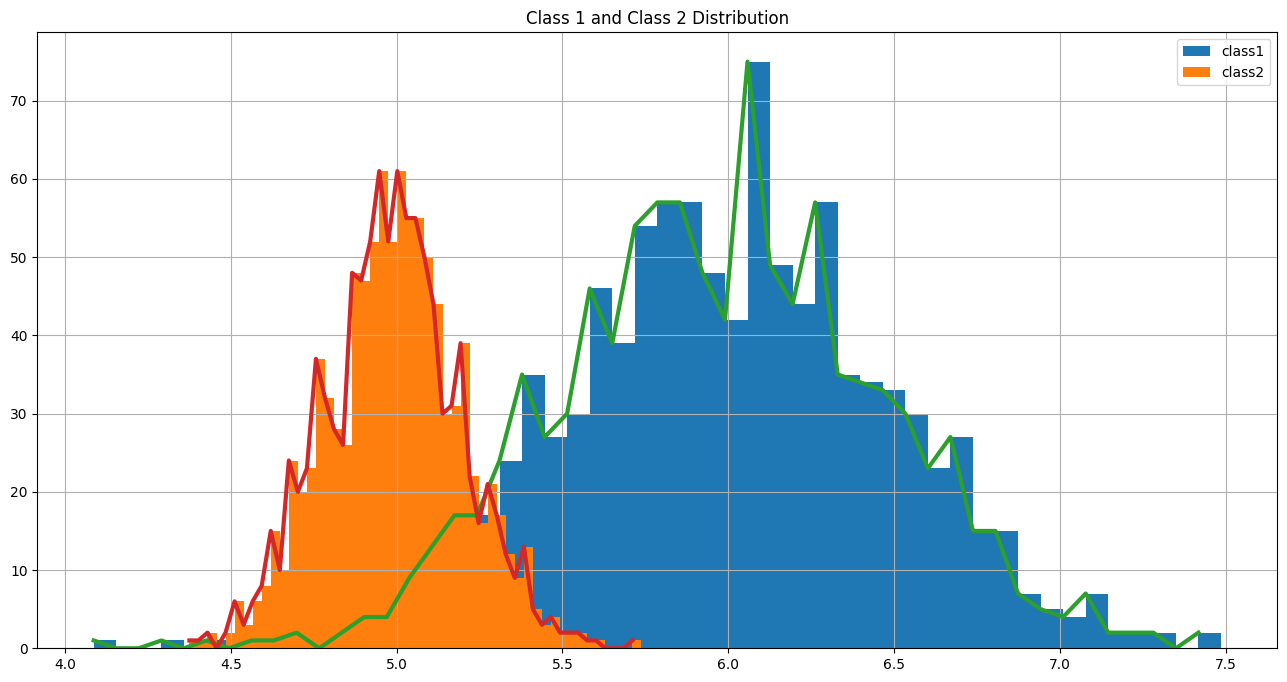
Let’s look at a sample distribution of two classes based on a single feature. Each class is associated with a person and measure a feature from each person. A feature is any characteristic metric from a given class. For example, this feature would be a person’s height taken from some sensor and some given noise. The signal is emulated by using a gaussian signal with some mean and standard deviation.
# define class 1
mean_c1 = 6
std_c1 = 0.5

# define class 2
mean_c2 = 5
std_c2 = 0.2

num_samples = 1000

# generate random samples for class 1 and class 2
class1 = np.random.normal(mean_c1, std_c1, num_samples)
class2 = np.random.normal(mean_c2, std_c2, num_samples)
hy1, hx1 = np.histogram(class1, bins=50)
hy2, hx2 = np.histogram(class2, bins=50)

plt.figure(figsize=(16,8))
plt.hist(class1, label='class1', bins=50)
plt.hist(class2, label='class2', bins=50)
plt.plot(hx1[:-1], hy1, linewidth=3)
plt.plot(hx2[:-1], hy2, linewidth=3)
plt.grid()
plt.legend()
plt.title('Class 1 and Class 2 Distribution')
Text(0.5, 1.0, 'Class 1 and Class 2 Distribution')